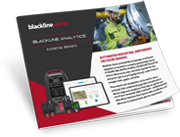
Get a complete view of worker and site safety with the comprehensive Blackline Analytics reporting platform.
This suite of automated reports delivers reliable data and trustworthy information, freeing you from tedious manual work.
Never wait for manual collection of usage data and gas reading information to know if your fleet is compliant and that your teams’ safety is accounted for. Automated reporting ensures accuracy, eliminates reporting errors and improves efficiency.
Blackline Analytics
More Data. Less Work.
Say goodbye to spreadsheets and easily identify data-informed opportunities to prevent incidents, improve safety and boost operational performance.
- Recognize how and when safety devices are used to manage compliance
- Understand hazards workers are exposed to proactively mitigate them
- See aggregated trends and worksite comparisons to improve protocols and processes
Essential Reports
Best-in-class, standard suite to help solve common challenges around compliance, performance, and safety. Out-of-the-box and included with every device service plan, Essential Reports are presented in effortless, ready-made, easy-to-read visuals and interactive dashboards.
Compliance and Fleet Management Analytics
- Every bump test, calibration, gas exposure and usage session automatically recorded for hassle-free reporting
- Single source of historical data is stored, and compliance shown, in just a few clicks
- Device assignment history and associated reporting is effortless
Performance and Safety Analytics
- Identify patterns in when and where incidents or gas leaks occur and take action to mitigate
- Gain insights into how, when and where devices are used to understand worker behaviors, improve scheduling, and amplify productivity
- Associated reporting includes a robust overview dashboard, gas exposures, events report and more
Emailed Reports
You decide how you want to receive your Essential Reports. Set up emailed reports on critical metrics direct to your inbox or leverage the suite of interactive reports available in the Blackline Live portal.
Emailed reports are available for alerts, usage, and high gas exposures helping your managers in the field deliver informed safety talks that boost safety culture—all based on recent experiences at your own sites.
Optimize Operations
Reduce the cost and complexity of fleet management by spending less time managing your gas monitors and ensuring you get the most value out of your investment with the latest firmware.
- Regular over-the-air firmware updates mean devices are always up-to-date and operating optimally at all times
- Comprehensive overview of your fleet –including the latest firmware updates, battery life and device/cartridge maintenance notices – all in a single report
Enovert Uses Data Insights to Mitigate Risk
Discover how a leading landfill and waste resource management company uses Blackline Safety data analytics to enhance gas detection and exposure prevention.
“Data collection and analysis is the present and future of the industrial sector. With the data we’re able to collect, track and analyse, we can respond and adapt quickly if there is a risk of gas exposure, and also look back to take steps to mitigate that risk in the future. Data is a driving force in keeping our people safe and supporting our commitment to the environment.”
– Mark Silvester, CEO, Enovert
Unquestionable safety
Never rely on historical data to know if your fleet is compliant and that your teams’ safety is accounted for. All alert and situational data stream directly from your devices to Blackline Live in real time where it fuels professional emergency responses and intelligent efficiency studies. Access full visibility of your fleet from anywhere and trust that your teams are always covered.
Intelligent analytics
Blackline Analytics Essentials deliver a complete view of your fleet's operations. Easily identify how equipment is being used, where hazards are being encountered and even determine which devices are performing well and which can be leveraged better.
Every bump test, calibration, gas exposure and usage session is automatically recorded for hassle-free reporting. By leveraging out-of-the-box integrated connectivity and automated device log collection, your devices build a body of data today, providing measurable performance for tomorrow.
And that’s not where it ends. When you’re ready, premium analytics, powered by Blackline Vision , help you reveal efficiency opportunities on your worksite, proactively find gas leaks and more.
Ready when you are
Quickly assign shared devices between workers. Using a barcode scanner, on-the-fly device assignments are easy, changing from one user in a few seconds, making shift-changes a seamless operation.
Help is always on the line
Rest easy knowing the safety of your teams in the field is covered. Blackline’s Safety Operations Center (SOC) is the critical link between your employees and the help they need during an emergency, health event, dangerous situation and more.
With Blackline's optional 24/7 Live Monitoring service, 99% of calls for help are answered in under 60 seconds. From receipt through to resolution, responses are executed according to your custom emergency response protocol. The SOC team is even Five-Diamond Certified , meaning they are empowered to escalate responses to dispatch local emergency services to the employee’s exact location.
Always ahead of the curve
Blackline futureproofs your connected safety system, protecting your investment. Your G7 device is completely customizable and can be configured to accommodate diverse gas detection and safety monitoring needs, including no-gas lone worker, single-gas, multi-gas and multi-gas pump options. G7 can start life as a connected single-gas detector and be updated over time to support multiple gas sensors, walkie-talkie functionality and advanced lone worker monitoring. And because each unit connects directly to the Blackline Live, there’s no limit on the number of devices in your network.


